Your data is only as good as your ability to see it, especially on cloud databases like Salesforce. These platforms hold so much information — spread across thousands of records — that gleaning actionable insights becomes impossible without summary reports.
Much of the best Salesforce reporting functionality, however, isn’t readily apparent to new users — it took me, for example, months of Salesforce use to learn the ins and outs of reporting.
Following are five of the most valuable things I've learned. Together, they'll help you to filter, group and chart data in new ways, boosting your ability to view your Salesforce data in meaningful ways.
5 Tricks to Use in Salesforce Reports
1. Group records based on numbers, percentages and more with bucket fields.
(Possible in Salesforce Lightning and Classic)
When building Salesforce reports, have you ever wanted to group records based on something other than picklists? Maybe you’ve previously tried to arrange data based on a currency or number field, for example, and ended up with a terrible bar graph because your report created a separate bar for every unique value of that field.
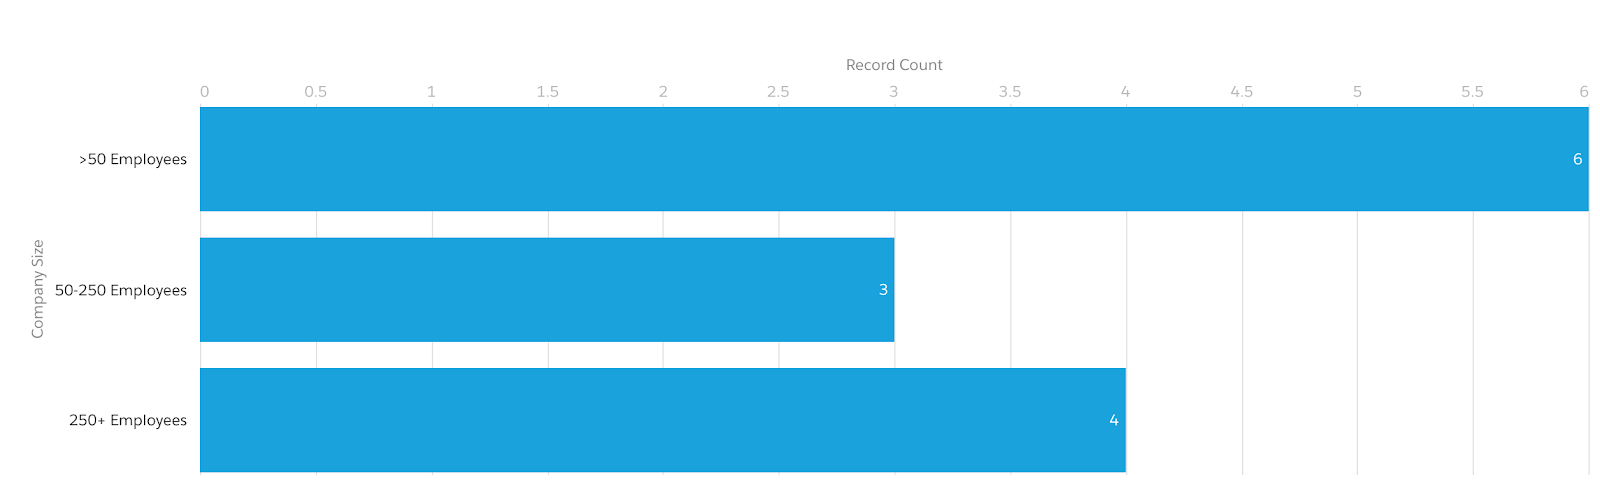
That’s where bucket fields are useful: they let you group records based on ranges of number, currency and picklist values. You can use this feature to select the variable to bucket by, define grouping ranges and give each one a custom label.
For example, this is your data with bucket fields:
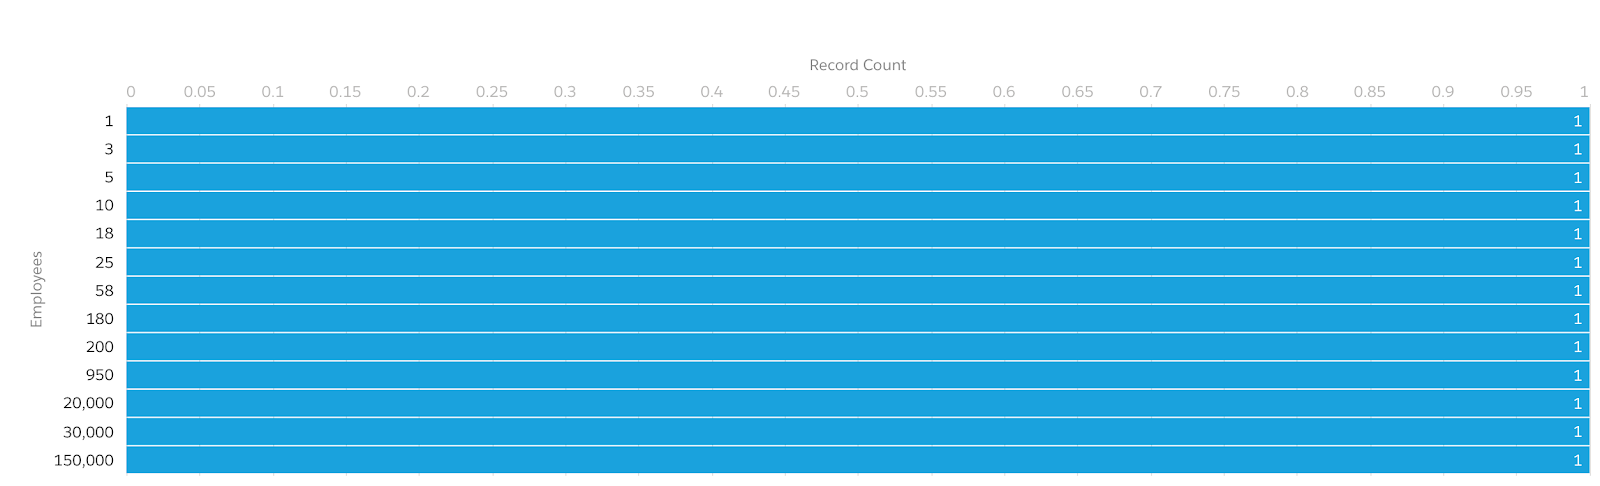
And without:
The list below provides some useful examples of bucket fields:
- Chart the number of accounts by employee number: 1-50, 50-250, 250+ (see example above)
- View total opportunity amounts by deal probability: 0-33%, 34-66%, 67-100%
- Graph the number of opportunities closed in the past year by their amount: $0-$50k, $50k-$250k, $250k-$1M, $1M+
2. Group records based on date ranges.
(Possible in Classic, but only viewable in Lightning)
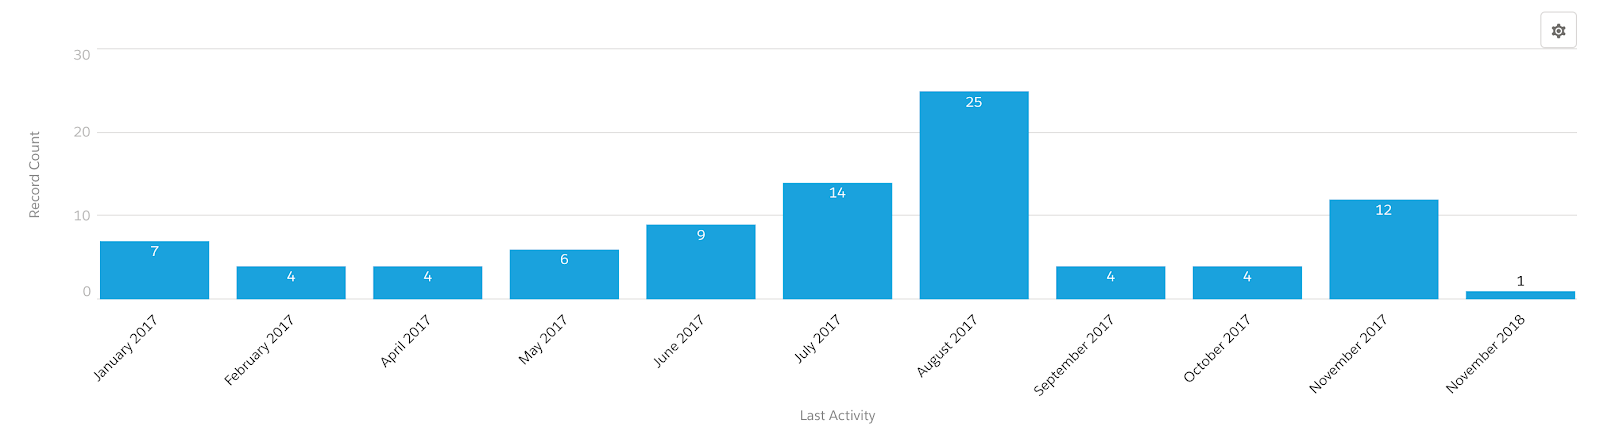
Salesforce similarly allows you to group date fields in reports by week, month, quarter or year so that you can spot long-term trends in your data. This feature is currently only accessible in the Classic report editor, but users may view reports using this feature in either interface.
For example, analyze change over time like this:
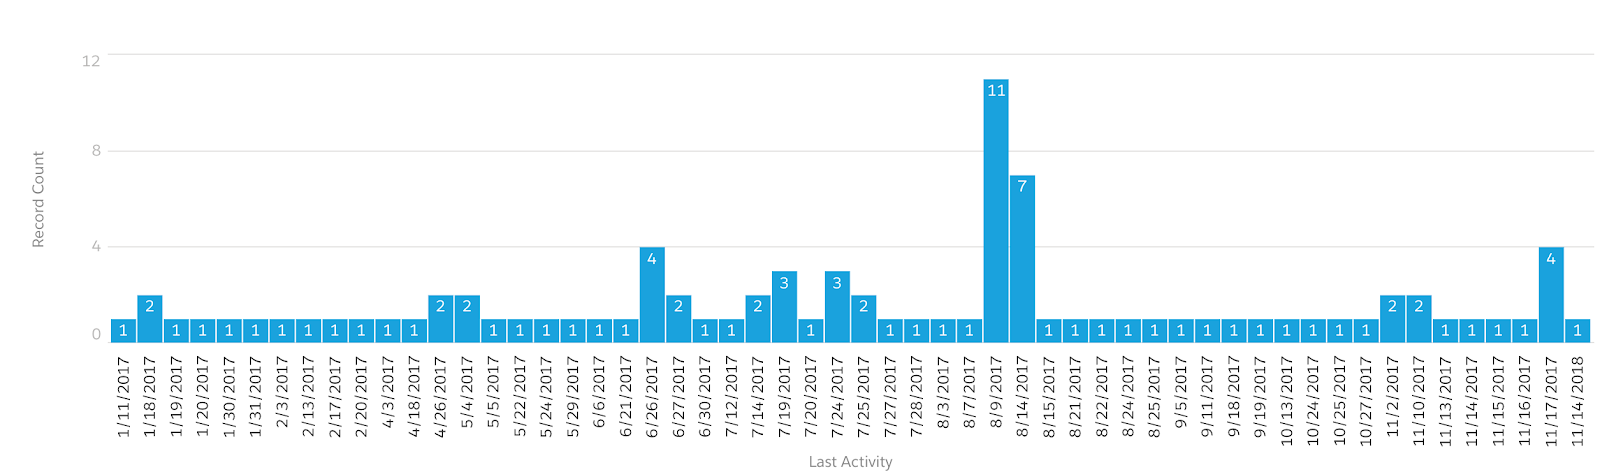
Not like this:
3. Crunch numbers on the fly by building summary formulas in your Salesforce reports.
(Possible in Salesforce Lightning and Classic)
{{cta('dd520b46-cd82-47d2-94af-54a7f3f90f31')}}
Most super users have witnessed the power of Salesforce formula fields, but not all of them know that they can create summary formulas directly in reports. With these formulas, you can crunch numbers as you build reports (like in Excel), so you can quickly and cleanly add one-off calculations to graphs, instead of waiting for your admin to create a field for you in Salesforce’s back end.
This functionality makes it possible to build Salesforce reports that:
- Calculate profit from each won opportunity, using amount and cost
- Chart the sales tax associated with each opportunity
- Graph the difference between max donation size and min donation size in each territory
4. Use relative date filters to see any point in time you want.
(Possible in Salesforce Lightning and Classic)
You know that super handy date filter that comes standard with every report? The one that allows you to filter records not only based on concrete dates, but also relative ones (This Year, Next Month, Last Fiscal Quarter, etc.)?
It’s incredibly helpful, but report builders quickly discover its limitations. For example, creating a report that shows opportunities that are closed and with a closed date this year is easy, but building one of the opportunities that are closed or with a closed date this year is much more difficult.
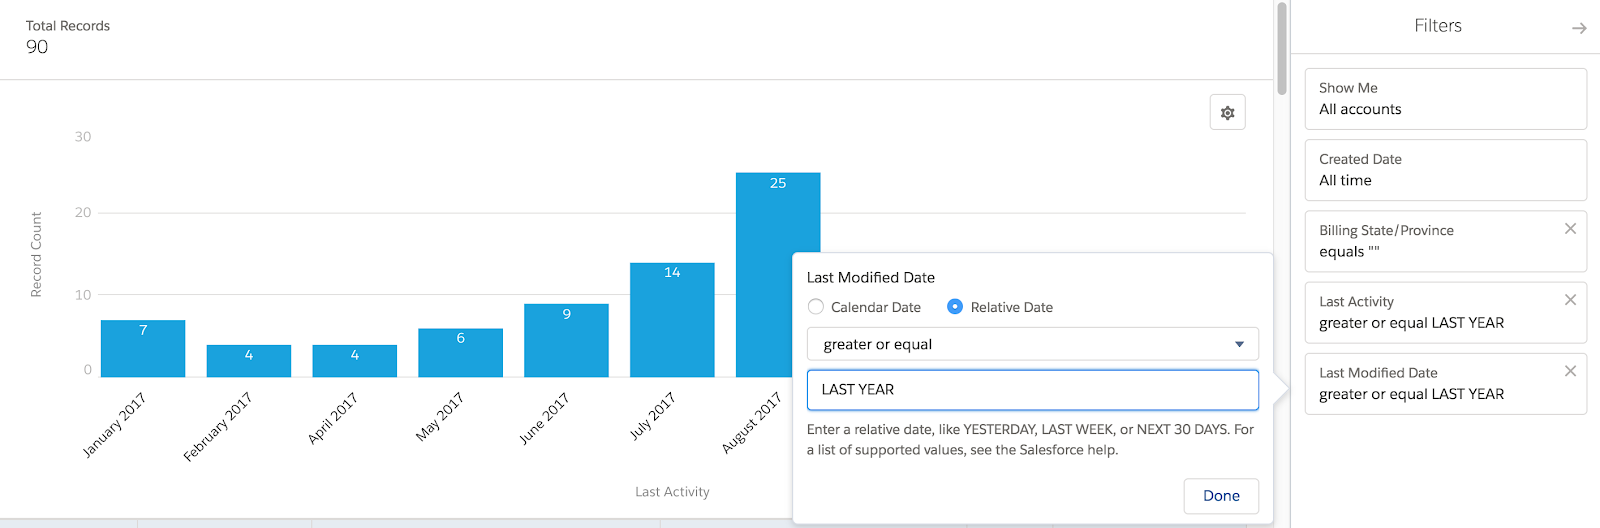
For that reason, Salesforce offers the ability to create custom relative date filters so you can use as many as you want — however you want them. The below examples showcase different ways to take advantage of this feature:
- Show opportunities created this month and closing next month
- Filter for open tasks with a due date in the future or no due date
- Find the number of accounts with a last modified date or last activity date more than six weeks ago
Here's what that looks like:
5. Let your users filter reports on the fly.
(Possible in Salesforce Lightning only.)
A single report or graph set in stone will rarely satisfy any data-driven executive. Instead, the best reports typically elicit more questions than they answer: Can I see this data by territory? Can you narrow the scope to this quarter? This month?
Thankfully, the Salesforce Lightning report view allows users to change report filters and graphs quickly, to slice and dice data however they see fit. Stakeholders can now change views dynamically on one screen; the same process requires three steps in Classic (edit, change filters, run report).
This sort of transformation doesn’t even force users to edit the underlying report, meaning that they can play with a graph however they wish without changing how the same report appears to colleagues.
The key to this trick? When adding a filter in the Lightning report builder, make sure you keep the “Locked” option unchecked. Building this way lets other users change the filter however they want.
This list by no means represents everything possible in the expansive world of Salesforce reporting but can get executives and admins started on the Salesforce reports they’ve always wanted. What are some of your favorite tricks? Or what troublesome reporting needs have you encountered in the past? Comment below, and we might cover them in our next blog on this topic!
