Hot take: The internet isn’t always helpful when it comes to finding the information you need.
As an example, try entering something like “CRM adoption stats” in your favorite search engine. Chances are, you’ll end up at a page filled with stats like “X percent of CRM projects fail.” While eye-catching, metrics like these are vague and hardly actionable. How do they define “failure?” What can a business do to avoid this fate? Is your business close to this outcome? These clickbaity stats provide more questions than answers, rendering them useless to business leaders trying to understand their tech health.
We’ve written a lot about CRM adoption, specifically about how to improve Salesforce adoption, but our team recently discovered that we’ve left a vital question unanswered. It’s one that any executive or manager will undoubtedly ask themselves if they’re concerned about adoption: “How do I know if my team is adopting Salesforce well?”
To answer the question, we scoured the internet and leveraged our internal expertise on the subject to find everything you need to know about Salesforce adoption success: which metrics to measure and how to benchmark your organization’s performance. This guide will help you understand how to get a pulse on your adoption and how your performance compares to the rest of the CRM industry.
Salesforce Adoption Metrics: How to Measure Success
One reason there are so many vague stats out there about Salesforce & CRM adoption? It’s difficult to define what “adoption” truly means. Adoption doesn’t represent a black-and-white line that your company has or hasn’t crossed. Instead, it best resembles a gray scale of performance, ranging from “Nobody logs into the platform” to “Our company lives and breathes Salesforce.”
Salesforce’s recommended metrics to track
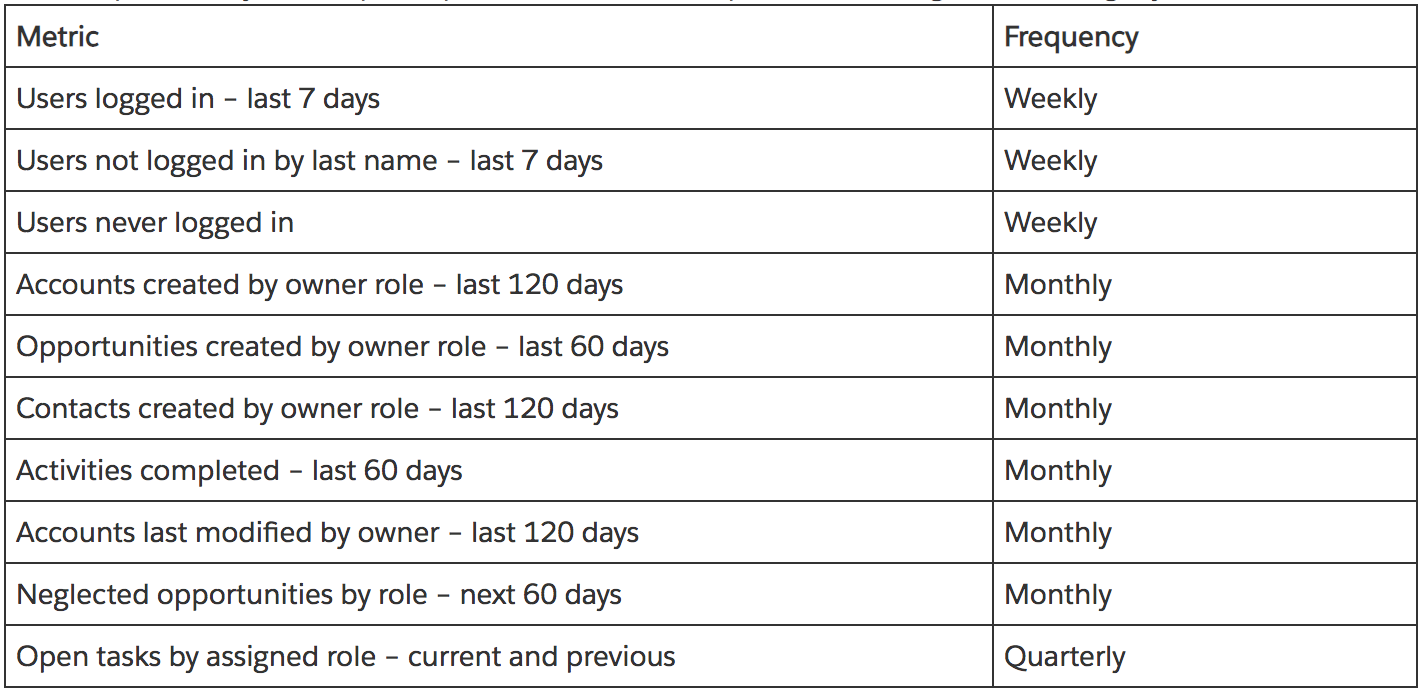
For this reason, you can’t measure Salesforce adoption by looking at one stat alone — like login rates. “Full adoption” consists of numerous behaviors, so the more of them you track, the better. Salesforce itself released a list of some sample adoption metrics to measure, which fall into three categories: usage, data quality and business performance. We’ve reposted these metrics here, along with how often Salesforce recommends checking each:
Usage Metrics:
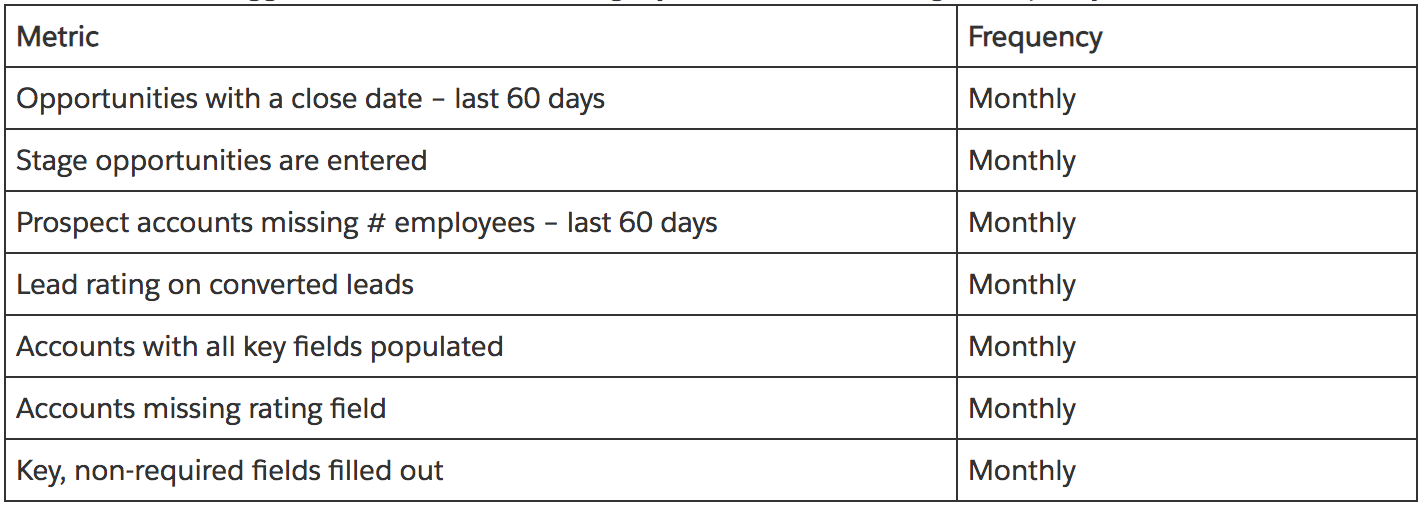
Data quality metrics:
Business performance metrics:
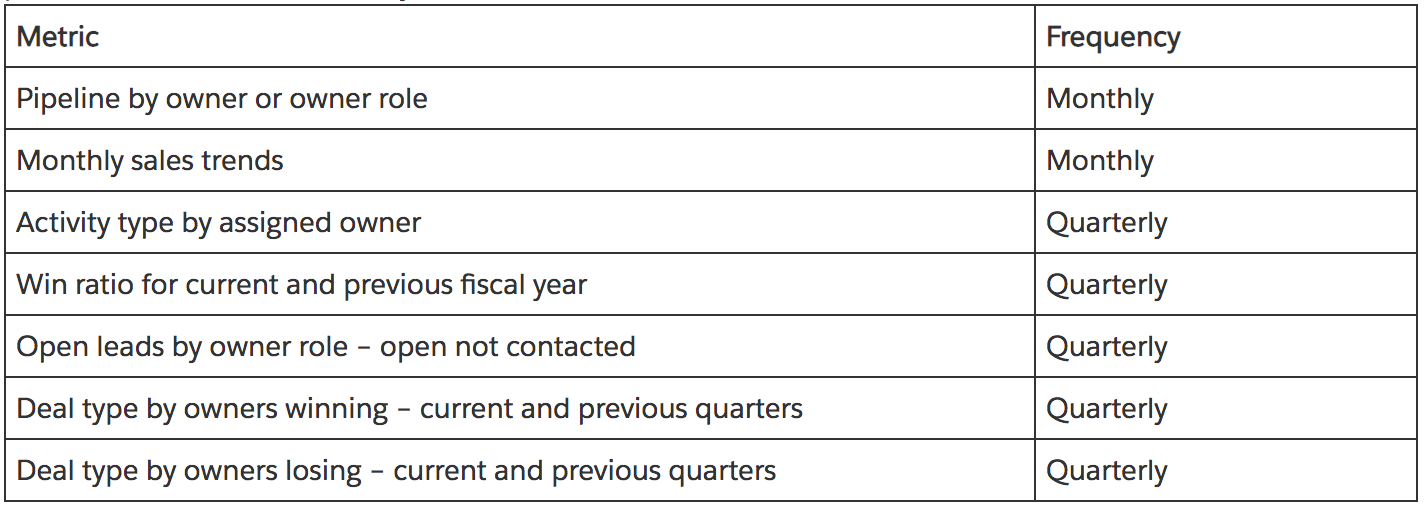
Now, of course, this list is only helpful if your team is using Sales Cloud — if you’re not using opportunities and/or leads, then tracking open opportunities and leads won’t help you. So it’s worth tailoring this list to match the Salesforce objects your team uses most for its business processes. But no matter how you’re using Salesforce, this list strikes at the idea that you need to track much more than usage. It’s not enough for your teams to just use Salesforce; a core component of adoption is using the platform correctly.
Tracking KPIs as adoption metrics
The list of business performance metrics highlights another crucial theme: Tracking KPIs in Salesforce is the same as monitoring adoption. As we’ve mentioned in a previous blog, tracking your KPIs in Salesforce makes good business sense for a lot of reasons — and here’s yet another one: Because if your Salesforce data shows your team meeting their goals on absolute KPIs (like Closed Won $, number of cases closed, leads converted, et cetera), that means that they’re not only using the platform but also tracking the right data on it. Meanwhile, if they’re not hitting their goals, you know that something’s wrong — performance or adoption.
{{cta('3dbb5a90-4860-430e-9c88-4a274c479c5c')}}
Salesforce Adoption Benchmarks: What Defines “Good” Adoption?
Even once you develop all the reporting you need to track the metrics mentioned above, that doesn’t necessarily tell you whether your organization has good adoption. You have no concept of the baseline or how other organizations are doing with their CRM. Placing your company’s stats alongside an industry-wide benchmark proves much more helpful.
CSO Insight’s CRM adoption benchmarks
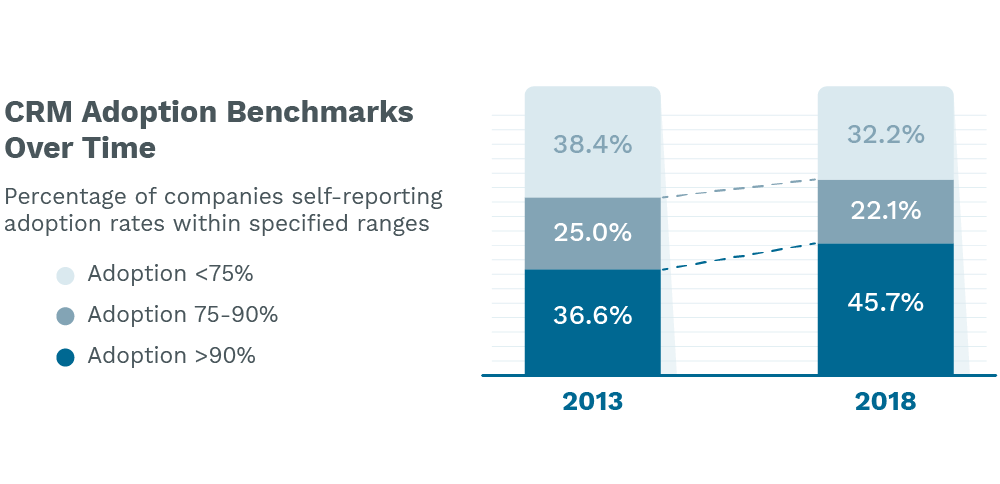
A helpful resource here is CSO Insight’s 2018 Sales Operations Optimization Study, which surveyed 300 participants about their CRM adoption usage, among other factors. Here’s what they found:
- 46 percent of their respondents reported having organization-wide CRM adoption rates above 90 percent — while 68 percent had adoption rates over 75 percent.
- Adoption has improved overall since 2013, when only 37 percent of respondents were over 90 percent, while 62 percent were above 75 percent adoption.
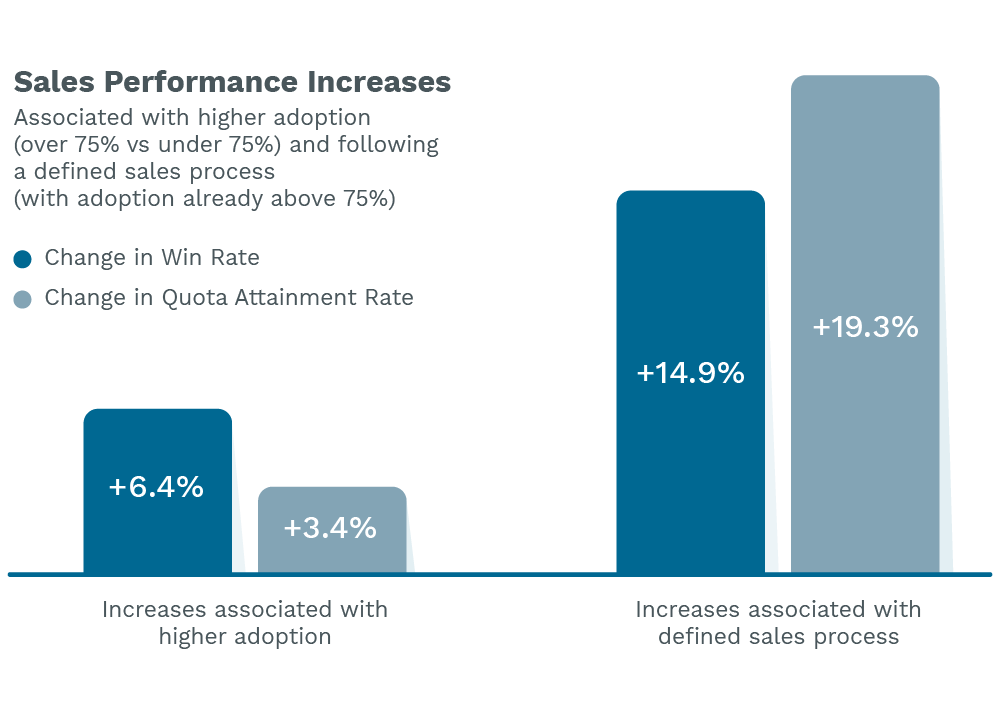
- Higher adoption correlated with better performance: Companies with adoption over 75 percent in 2018 reported win rates 6 percent higher, on average, than those with rates under 75 percent. Similarly, a business’s quota attainment rate was 3 percent higher, on average, when it had high CRM adoption (over 75 percent).
- But adoption alone wasn’t the most significant driver of performance improvement among CRM users — by far. The study saw a much higher boost in goal attainment in high-adoption orgs (over 75 percent) with structured sales processes, compared to high-adoption orgs without them. Following a defined sales process translated to a 15 percent increase in win rate and a 19 percent increase in quota attainment, on average.
So what does all of this mean?
The results show that adoption has improved across the CRM world in the past 5 years; at this point, over two-thirds of companies report adoption over 75 percent, and almost half have achieved adoption over 90 percent. Those two marks provide useful goals for your organization. What’s more, that 75 percent adoption rate is particularly valuable because surpassing that line should translate to better sales numbers (all else being equal).
Though these stats are obviously helpful, it’s unclear what “adoption” truly means in the context of this report. The results are survey-based, and the language in CSO Insight’s report suggests that these adoption rates are self-reported by the respondents. So with a vague term like “adoption,” it’s unclear if every respondent reported “adoption” the same way. For example, Companies A and B may have both reported CRM adoption rates above 90 percent, but if Company A meant “90 percent of my users log in to the platform at least once a week” while Company B meant “90 percent of my users actively engage with the platform daily,” then those mean completely different things for the organization.
These results themselves even highlight that concern by showing that the impact of higher CRM “adoption” on sales performance is dwarfed by the impact of having a defined sales process. We’ve discussed the importance of supporting your CRM strategy with established business processes before on this blog — this result backs that idea. It also highlights an earlier point we made about adoption: It’s not enough to have employees logging into the system, it’s much more important that they're actively using it to drive toward defined business outcomes. That only happens when your definition of adoption involves adherence to CRM processes.
Other useful CRM adoption benchmarks
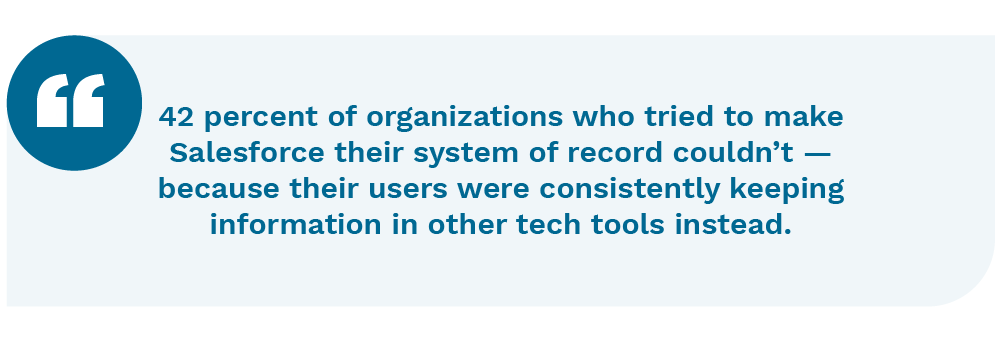
To get some slightly different measures of widespread CRM usage, let’s take a look at two telling stats from other sources. Though Cloudingo’s 2017 Salesforce User’s Benchmark Report didn’t feature any stats about adoption specifically, it did uncover an interesting, relevant nugget. The survey found that, among those who intended to use Salesforce as their “source of truth” for data, 42 percent of respondents admitted that users consistently stored data outside of the platform (in spreadsheets, email clients, etc.). Put another way, 42 percent of organizations who tried to make Salesforce their system of record couldn’t — because their users were consistently keeping information in other tech tools instead. And that’s an adoption problem.
Also, a U.K. study cited by Academic Room found that 43 percent of CRM users take advantage of less than half of the CRM functionality available to them. Interestingly, this speaks to another aspect of CRM adoption, but the ~40 percent noncompliance rate holds true. So, whether we’re talking about using most of a CRM’s functionality or faithfully entering data in the platform, perhaps that 60 percent rate represents a useful benchmark for more active forms of CRM user adoption — beyond just logging in regularly.
Another benefit of tracking KPIs as adoption metrics — easy benchmarking
One final note on Salesforce adoption benchmarks: You’ve probably noticed that none of these stats line up perfectly with the recommended adoption metrics to track provided by Salesforce. Yup, that’s a major problem here. It’s near impossible to find the right benchmark for the specific way that your company measures adoption. Have we mentioned that this is a tricky metric to nail down?
But this problem highlights yet another great reason to track adoption via KPIs. You’ve likely already set KPI goals with your teams. They may even be benchmarked according to industry standards. So, tracking those metrics within Salesforce makes it much easier to understand your Salesforce performance (and adoption) against where your company should be. Sure, if you’re low on your KPIs, you need to tease out what’s due to adoption and what’s due to performance, but knowing is half the battle.
Conclusion: Our Recommended Benchmarks
What does this all mean for your business? Well, from all of these stats and metrics, we’ve learned that there are two types of adoption: passive and active. Passive adoption involves logging into a system for some tasks without truly engaging with the system as intended. Active adoption involves more. A user has actively adopted Salesforce if they are:
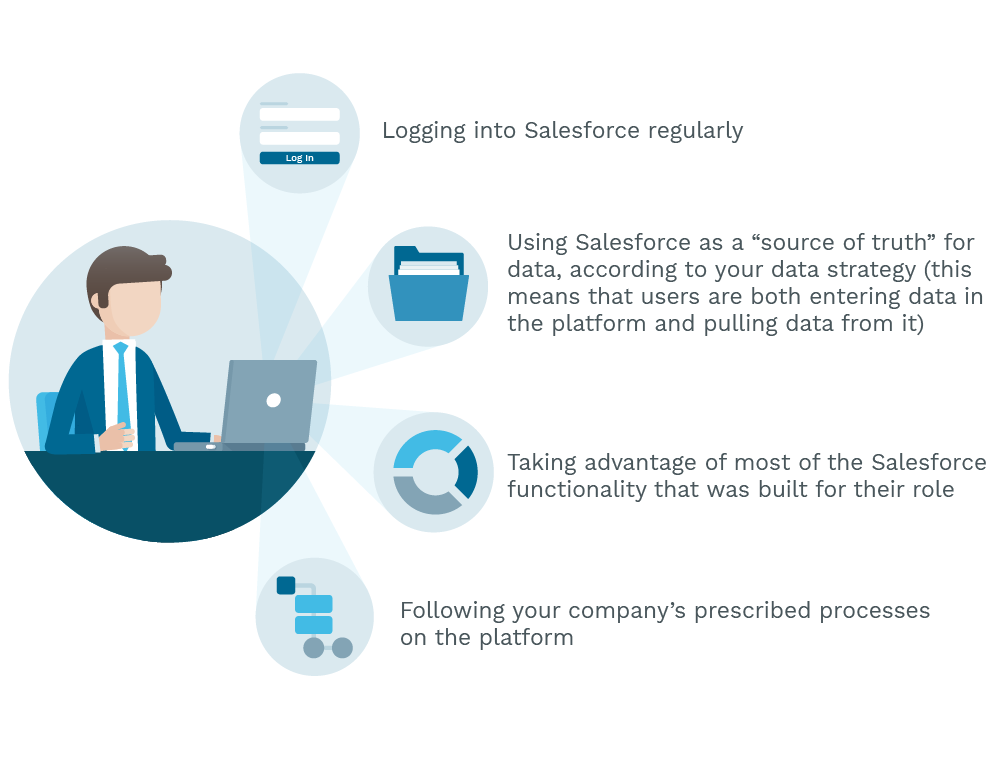 And this definition isn’t any more complicated than what we’ve already been discussing — measuring the Salesforce adoption metrics we listed above will tell you precisely which users are doing these things and which aren’t.
And now for our recommended benchmarks. If you’re only measuring passive adoption metrics (like logins), then using the guidelines from CSO Insights is fine. A user adoption rate between 75 percent and 90 percent is about average, while one over 90 percent is “good” to “great” (depending on how active your users are).
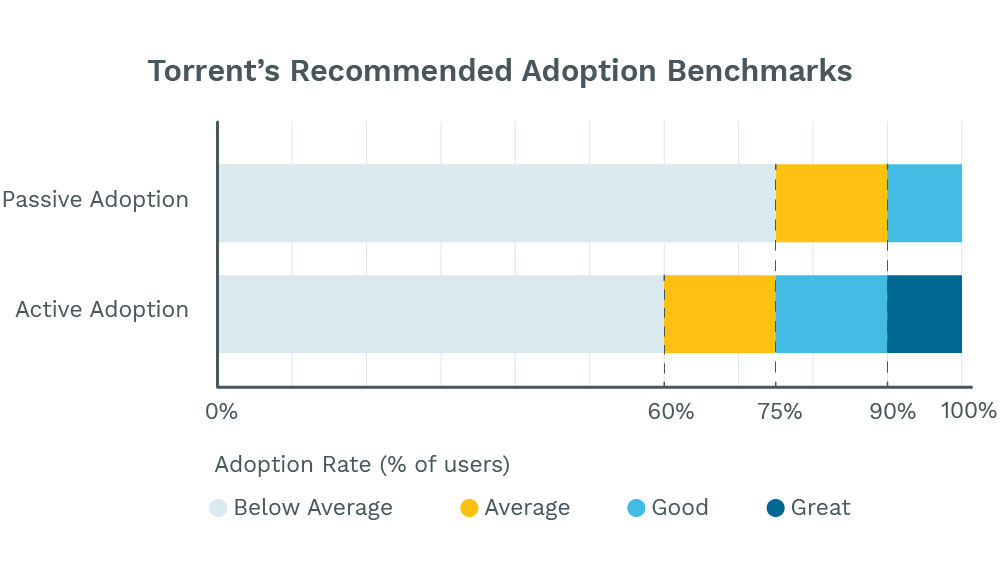
But if you’re measuring adoption more actively, then I worry that definition represents a stricter standard than the one used in the CSO Insights report. Instead, combining those levels with our other benchmarks, we’d say that an “active” adoption rate between 60 percent and 75 percent is about average, 75 percent to 90 percent is good, and anything over 90 percent is great.
Questions or comments about these Salesforce adoption metrics? Want to discuss your org’s own adoption rates and what they mean? Feel free to comment below! Otherwise, if you’d like more adoption tips, check out our on-demand webinar on the subject: 7 Advanced Strategies that Drive Salesforce Adoption.
